Visualization
chemFilters includes MolPlotter and MolGridPlotter for rendering molecules with
RDKit’s MolDraw2DCairo. Both classes support extensive customization of the rendering
process through constructor parameters and RDKit draw options.
Single molecule rendering
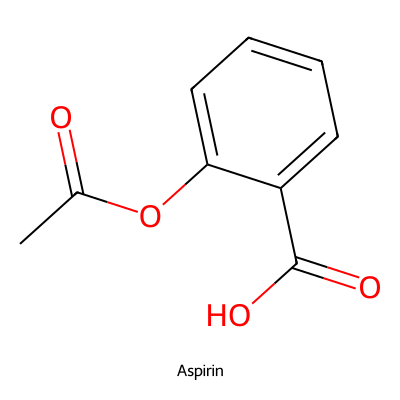
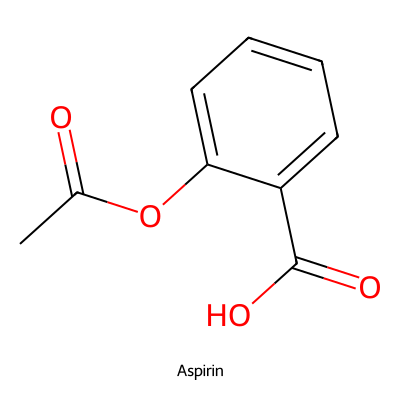
MolPlotter renders individual molecules as PIL images or SVG strings.
from rdkit import Chem
from chemFilters.img_render import MolPlotter

mol = Chem.MolFromSmiles("CC(=O)Oc1ccccc1C(=O)O")

plotter = MolPlotter(from_smi=False, size=(400, 400))
img = plotter.render_mol(mol, label="Aspirin")
SVG output
Pass return_svg=True to get an SVG string instead of a PIL image:
svg_text = plotter.render_mol(mol, label="Aspirin", return_svg=True)
ACS 1996 style
Render molecules following the American Chemical Society (ACS) 1996 drawing standards.
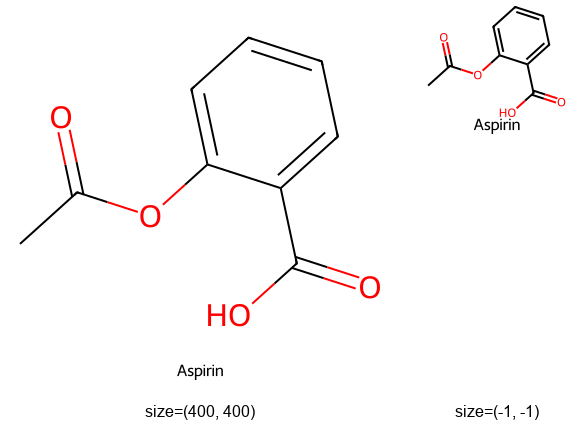
Because ACS 1996 enforces fixed bond lengths, the molecule size on the canvas is
determined by the standard rather than the size parameter. Passing a large fixed size
will result in blank space around the structure. Using size=(-1, -1) for a flexible
canvas (see Flexible canvas) avoids this, but produces a small
image since bond lengths are fixed. Use label_font_size to keep the label
proportional:
plotter = MolPlotter(from_smi=False, size=(-1, -1), label_font_size=8)
img = plotter.render_ACS1996(mol, label="Aspirin")

Pose matching
Align a molecule’s 2D depiction to a reference structure using match_pose. This
accepts SMILES, SMARTS, or an rdkit.Chem.Mol object:
img = plotter.render_mol(mol, match_pose="c1ccccc1")
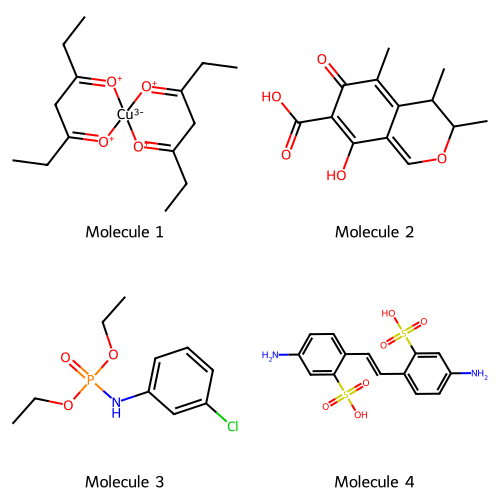
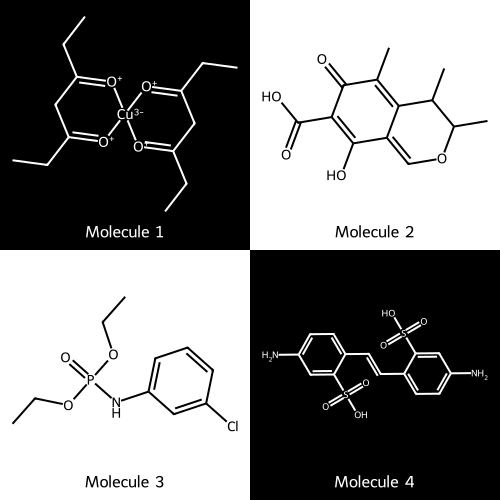
Molecule grids
MolGridPlotter extends MolPlotter to arrange multiple molecules into a grid image.
from chemFilters.img_render import MolGridPlotter

mols = [
    Chem.MolFromSmiles("CCC1=[O+][Cu-3]2([O+]=C(CC)C1)[O+]=C(CC)CC(CC)=[O+]2"),
    Chem.MolFromSmiles("CC1=C2C(=COC(C)C2C)C(O)=C(C(=O)O)C1=O"),
    Chem.MolFromSmiles("CCOP(=O)(Nc1cccc(Cl)c1)OCC"),
    Chem.MolFromSmiles("Nc1ccc(C=Cc2ccc(N)cc2S(=O)(=O)O)c(S(=O)(=O)O)c1"),
]
labels = [f"Molecule {i}" for i in range(1, len(mols) + 1)]

grid_plotter = MolGridPlotter(from_smi=False, font_name="Telex-Regular")
img = grid_plotter.mol_grid_png(mols, n_cols=2, labels=labels)
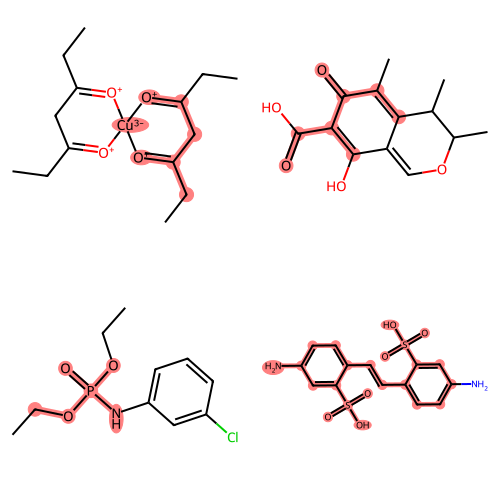
Substructure match highlighting
After filtering molecules with RdkitFilters, you can highlight the matched
substructures on a grid:
from chemFilters import RdkitFilters

chemFilter = RdkitFilters(filter_type="ALL")
filter_names, descriptions, substructs = chemFilter.filter_mols(mols)

grid_plotter = MolGridPlotter(
    from_smi=False, font_name="Telex-Regular", size=(250, 250)
)
img = grid_plotter.mol_structmatch_grid_png(mols, substructs=substructs, n_cols=2)
For a single molecule, use render_with_matches directly:
plotter = MolPlotter(from_smi=False)
img = plotter.render_with_matches(
    mols[0], substructs=substructs[0], label="Molecule 1"
)
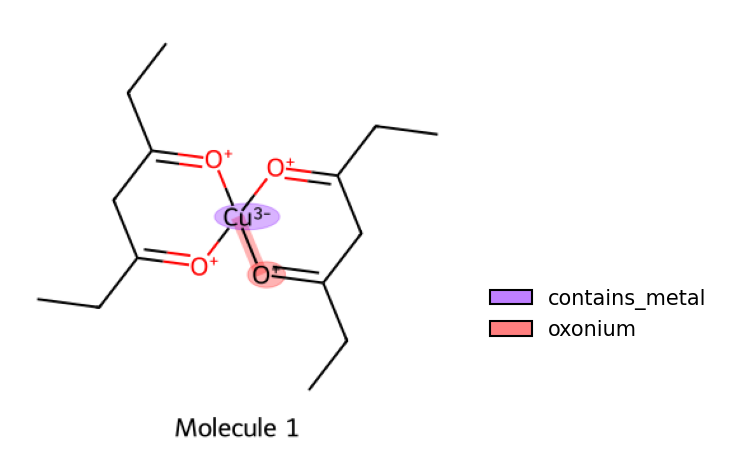
Colored substructure matches
Each matched substructure can be rendered in a different color. When substructures overlap, the colors are blended using their geometric mean.
import matplotlib.pyplot as plt
from chemFilters.img_render import MolPlotter

chemFilter = RdkitFilters(filter_type="NIH")
filter_names, descriptions, substructs = chemFilter.filter_mols(mols)

plotter = MolPlotter(
    from_smi=False, label_font_size=20, size=(350, 350), font_name="Telex-Regular"
)
img = plotter.render_with_colored_matches(
    mols[0],
    descriptions=descriptions[0],
    substructs=substructs[0],
    label="Molecule 1",
    alpha=0.3,
)

plt.imshow(img)
ax = plt.gca()
ax.set_axis_off()
plotter.colored_matches_legend(descriptions[0], substructs[0], ax=ax)
For grids with colored matches, use mol_structmatch_color_grid_png:
grid_plotter = MolGridPlotter(from_smi=False, size=(350, 350))
img = grid_plotter.mol_structmatch_color_grid_png(
    mols, descriptions=descriptions, substructs=substructs, n_cols=2
)
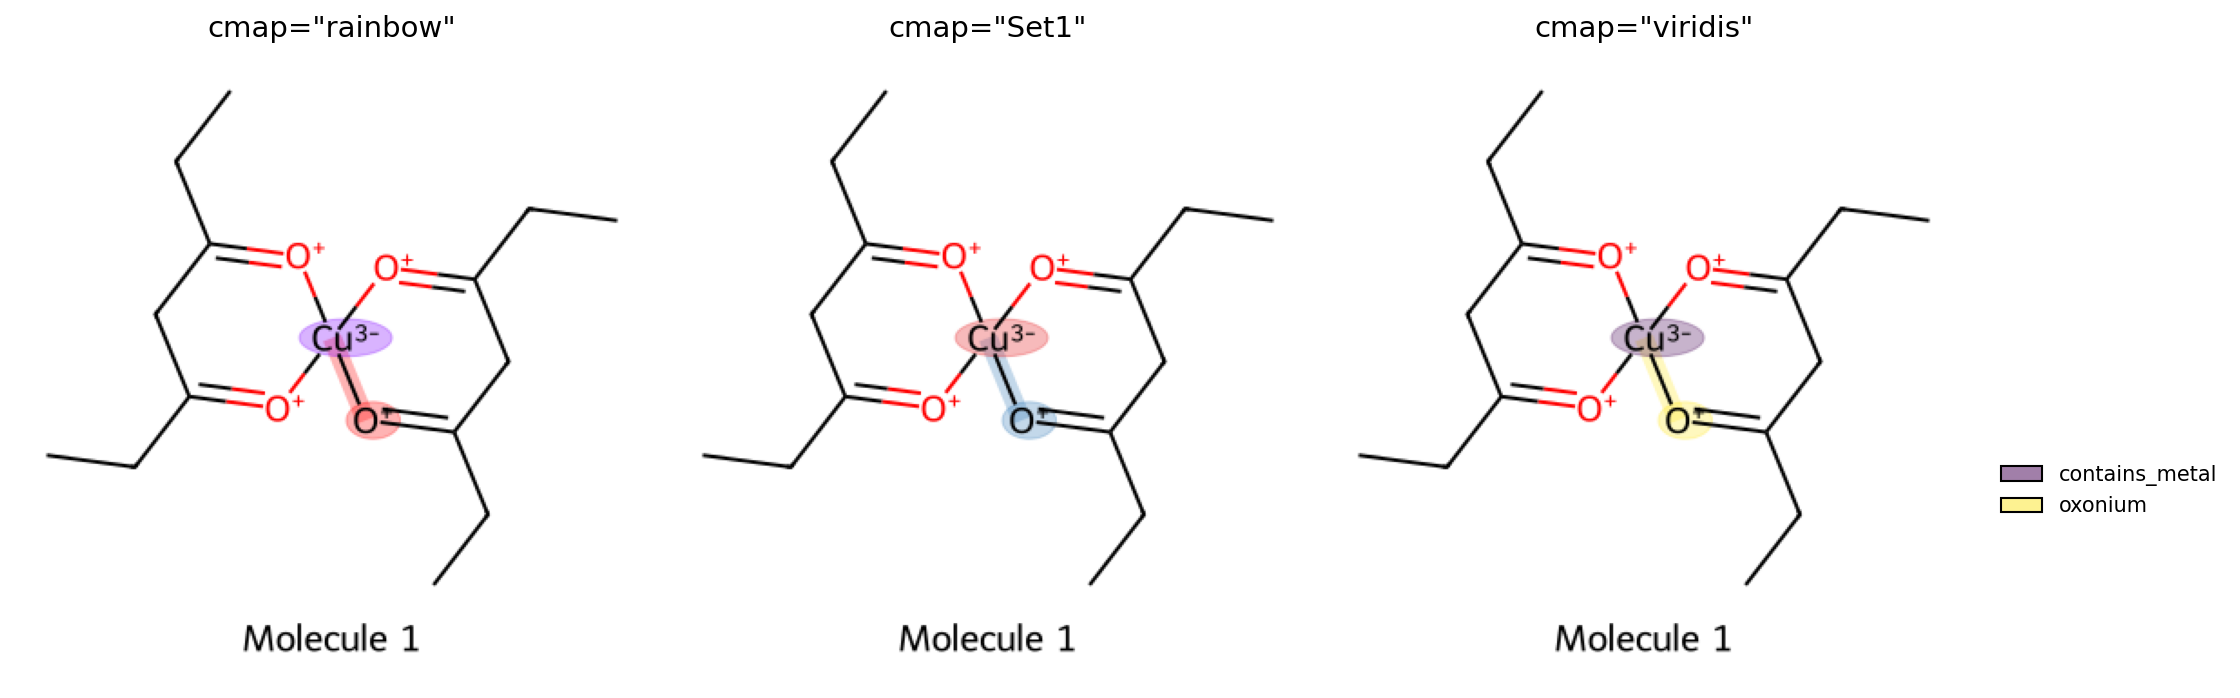
Colormap options
The cmap parameter controls the colormap used for highlighting substructures.
Any matplotlib colormap name is accepted:
Customizing rendering options
Both MolPlotter and MolGridPlotter expose several options that map to RDKit’s
MolDraw2DCairo settings:
Parameter |
Default |
Description |
|---|---|---|
|
|
Image dimensions in pixels; |
|
|
Matplotlib colormap for colored matches |
|
|
Font for molecule labels |
|
|
Custom font size for labels |
|
|
Custom font size on the molecule drawing |
|
|
Scale factor for annotation font size |
|
|
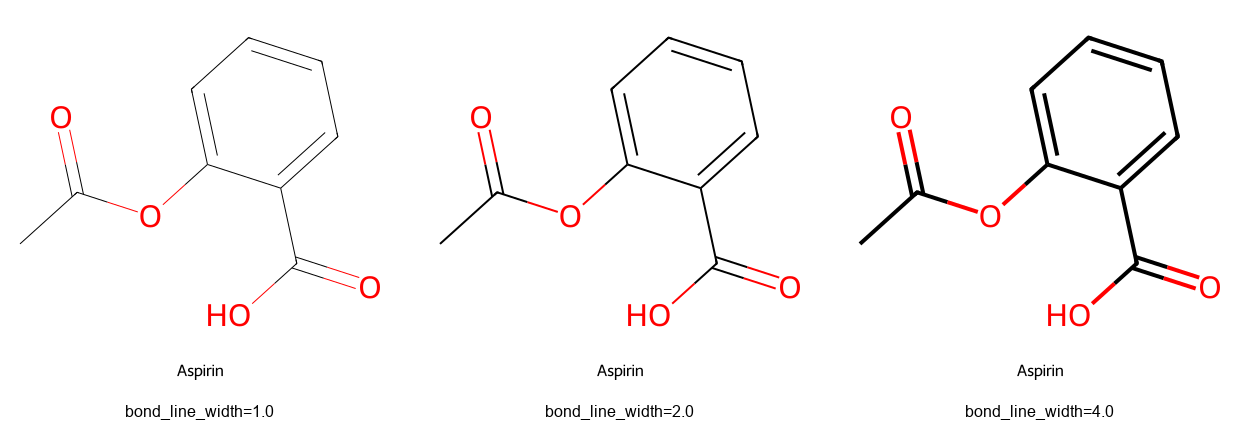
Width of bond lines |
|
|
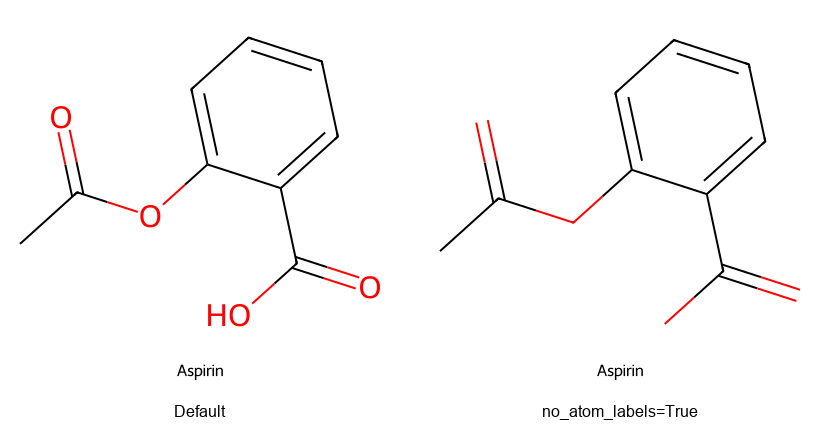
Suppress atom labels |
|
|
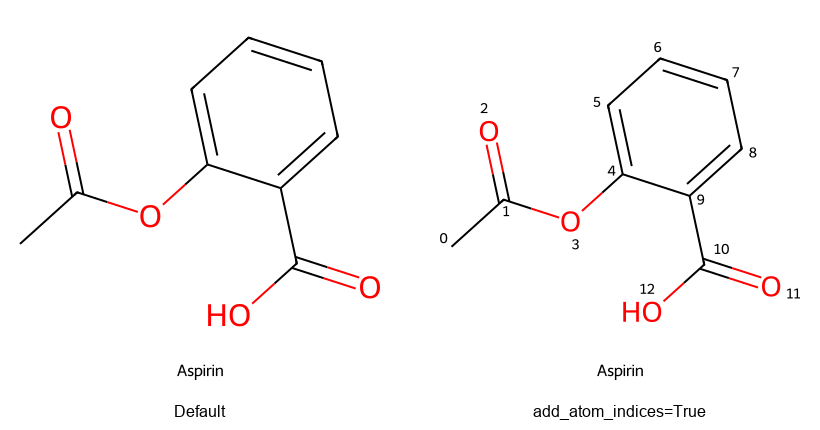
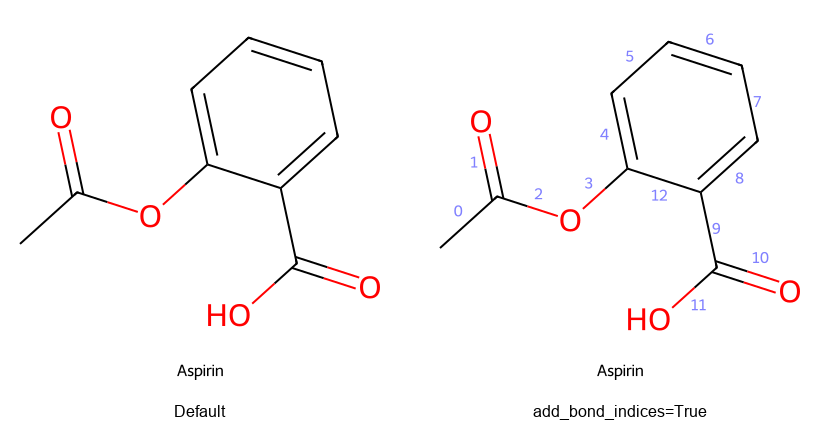
Display atom indices |
|
|
Display bond indices |
|
|
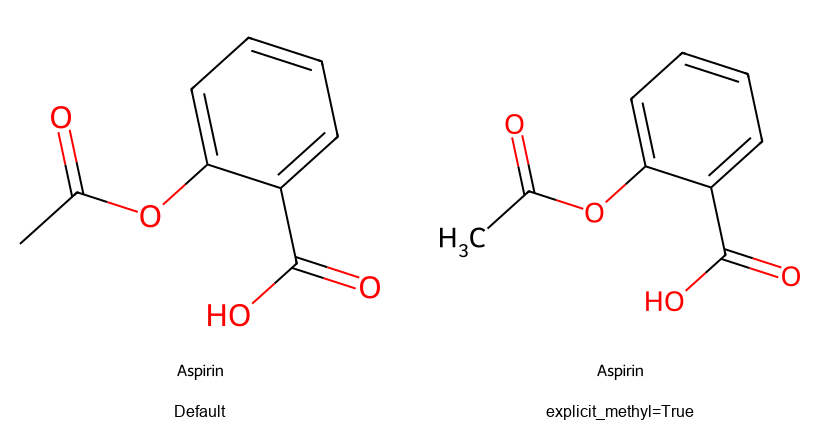
Show methyl groups as CH3 |
|
|
Draw unspecified stereo as unknown |
|
|
Transparent background |
|
|
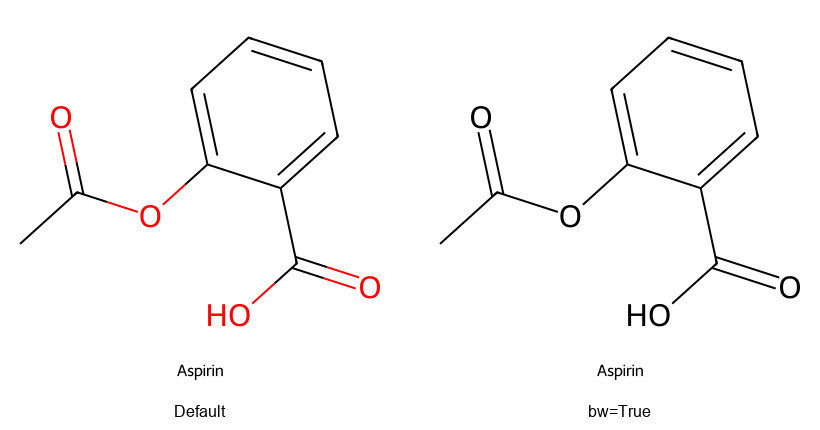
Black-and-white rendering |
Additional MolDraw2D options can be passed as keyword arguments:
plotter = MolPlotter(
    from_smi=False,
    size=(500, 500),
    bw=True,
    bg_transparent=True,
    bond_line_width=3.0,
)
Visual parameter effects
Flexible canvas
Pass size=(-1, -1) to let RDKit auto-size the image to fit the molecule, avoiding
blank space around the structure:
plotter = MolPlotter(from_smi=False, size=(-1, -1))
img = plotter.render_mol(mol, label="Aspirin")
Black and white mode
Atom and bond indices
Explicit methyl groups
Suppressing atom labels
Bond line width
Transparent background
Chess grid example
If for some reason (?) you want to create a chess-like rendering of compounds, you can combine
the bw=True option with PIL ImageOps.invert to produce alternating black-on-white and
white-on-black cells:
from PIL import ImageOps

grid_plotter = MolGridPlotter(from_smi=False, font_name="Telex-Regular", size=(250, 250), bw=True)

cell_imgs = [grid_plotter.render_mol(mol, label=label) for mol, label in zip(mols, labels)]

processed = []
for idx, img in enumerate(cell_imgs):
    row, col = divmod(idx, 2)
    if (row + col) % 2 == 0:
        processed.append(ImageOps.invert(img.convert("RGB")))
    else:
        processed.append(img.convert("RGB"))
Font management
FontManager discovers fonts available on the system, including fonts from matplotlib
and RDKit. It supports Windows, Linux, macOS, and WSL.
from chemFilters.img_render import FontManager

fm = FontManager()

# List all available fonts
print(fm.list_available_fonts())

# Check if a specific font exists
fm.has_font("Telex-Regular")

# Get the path to a font file
fm.get_font_path("Telex-Regular")
Parallel rendering
Both MolPlotter and MolGridPlotter support parallel rendering via n_jobs:
grid_plotter = MolGridPlotter(from_smi=False, n_jobs=4)
img = grid_plotter.mol_grid_png(mols, n_cols=2)